|
|
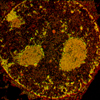
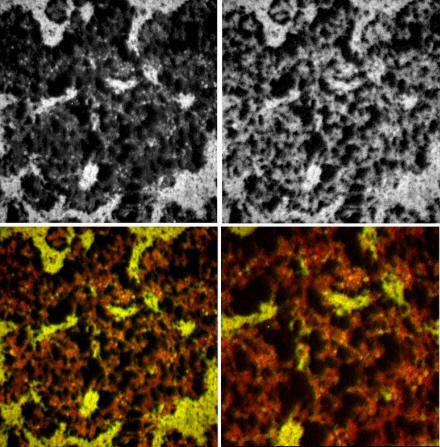
Electron spectroscopic imaging (ESI), also known as
energy filtered transmission electron microscopy (EFTEM),
couples an electron energy loss imaging spectrometer to a
conventional transmission electron microscope to enable the
direct quantitative imaging of elements within the specimen.
By coupling the spatial information provided by transmission
electron microscopy with the quantitative compositional
information provided by electron spectroscopic imaging, the
nucleoplasm can be studied in unprecedented detail.
The example on the left shows how phosphorus (top left) and
nitrogen (top right) maps can be combined to reveal the
composition of the interchromatin space. The
phosphorus rich chromatin fibers and ribonucleoprotein
particles appear yellow in the bottom panel, where
phosphorus is false-coloured green and nitrogen is
false-coloured red. Because protein structures have
relatively little phosphorus by mass but, like DNA and RNA,
are rich in nitrogen, protein structures appear red in the
bottom panels. |
| Copyright 2007 Michael J Hendzel, Ph.D. Department of Oncology, University of Alberta |